Figure 2 shows the performance of a typical table top circulator set at 25°C. The horizontal (or time) scale is set at 2 minutes per division and the vertical (or temperature) scale is set at 0.02°C per division. We can see that the performance of the circulator is quite impressive as the temperature variation over an 18-minute time period is well below ±0.01°C. In Figure 3 we examine one of our High Precision Circulator Baths, and while the time scale is set to the same time interval (2 minutes per division), the temperature scale has been zoomed in to 0.002°C per division. The temperature variation of the High Precision Circulator Baths, however, is only slightly over ±0.001°C or one millidegree C.
Figure 2
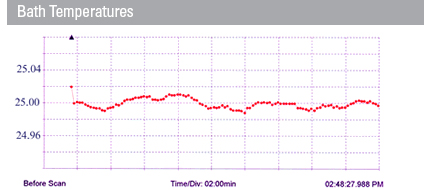
Figure 3
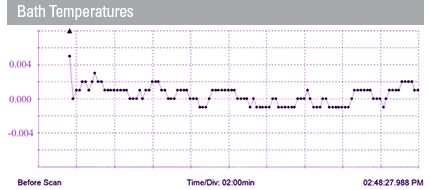
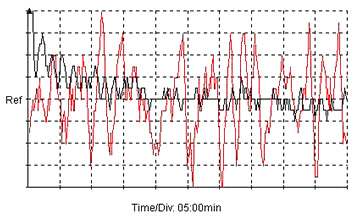
Figure 4 shows the performance of both circulators plotted on a single graph. The improvement in our temperature control is quite obvious with both baths plotted at 0.002°C per division.
Figure 4
Up to this point we have used the ADC system to explore the advantages of our high precision circulator baths -a relatively simple task for a device of this magnitude. For the bath comparison, we plotted only two channels of temperature data at ten second intervals. Next we will look at plotting thermistors as well as the temperature of the bath.